UX Research Project for the Automation Lab: Automation Dashboard
Automation Lab Team: 2 Project Managers, 10 Developers
Project Timeline: September 2025 – Present
Background
Prior to the creation of the Automation Lab, data entry for ACORD forms was handled manually, typically by overnight teams, so that information would be available by the next business day. The Automation Lab was established to develop a scalable, company-wide solution to automate ACORD form processing for underwriters and processors, thereby streamlining the manual data entry workflow.
In addition to automation, the stored data required a front-end interface to enable access across various business units for New Business Submissions. To meet this need, the development team built a dashboard. However, due to the project’s early, beta-stage nature, no designers were involved in the initial effort.
Over time, the dashboard gained significant traction across the organization. As adoption expanded, it became increasingly clear that a UX evaluation was necessary to better understand user experience and identify opportunities for improvement.
UX Integration
In September 2025, I joined the team as the sole UX designer, responsible for leading the research and discovery efforts to evaluate the Automation Dashboard.
As this was the team’s first experience working with a UX designer, it was important to establish clear expectations and address any questions about my role. Initially, there was some skepticism and resistance, as the team had operated independently for a couple years.
To build trust, I focused on establishing rapport and positioning myself as a collaborative partner rather than a disruptor. I made a conscious effort to understand the team’s perspective and acknowledge that this represented a significant shift in their workflow. By maintaining open communication and making myself readily available, I encouraged the team to share concerns and ideas for the future of this product.
Following an initial kickoff meeting, where I outlined my research approach, including user interviews and research deliverables, we aligned on goals and expectations.
User Interviews
Between September and December, I led 10 user interviews. In collaboration with the project managers, we selected participants representing both IT (4 users) and various business units (6 users), making sure we covered all areas of use.
To help build user empathy while maintaining a comfortable environment for participants, I limited attendance to one project manager and a pair of developers per session. This approach allowed team members to directly hear user feedback without overwhelming interviewees.
Research Deliverables
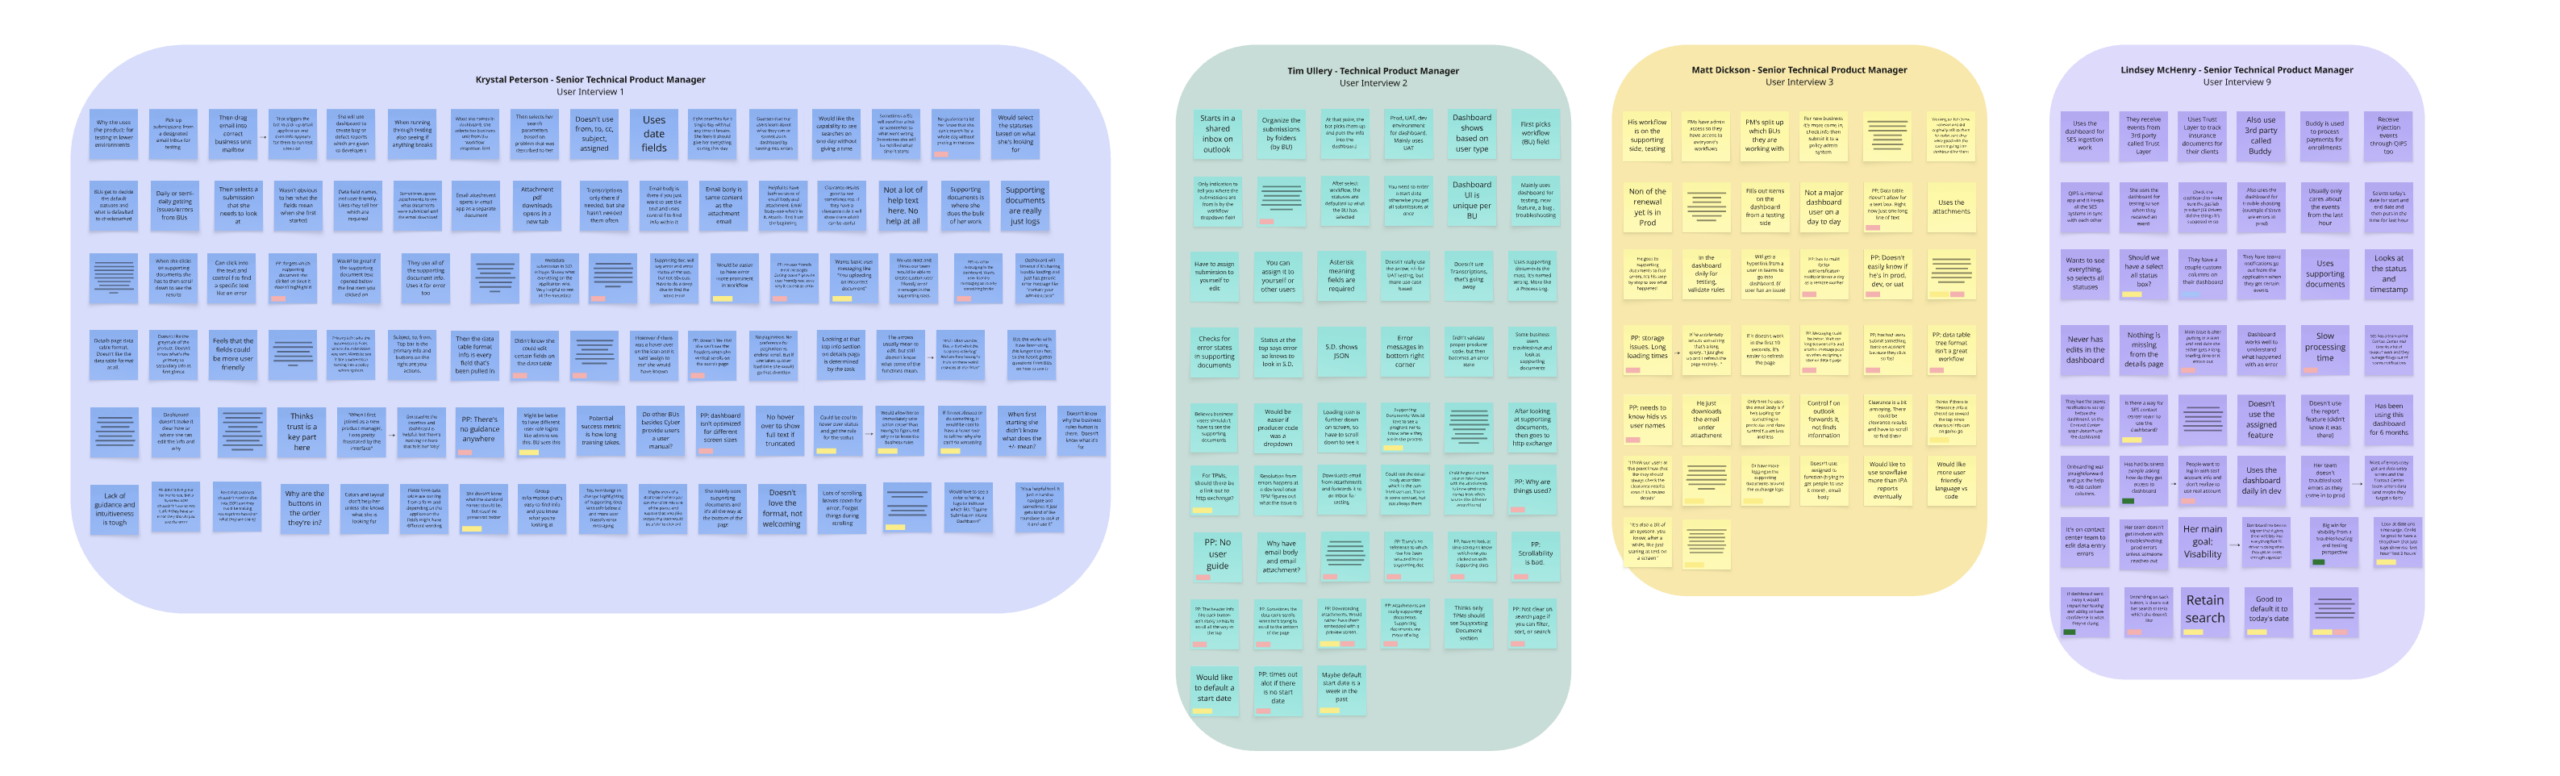
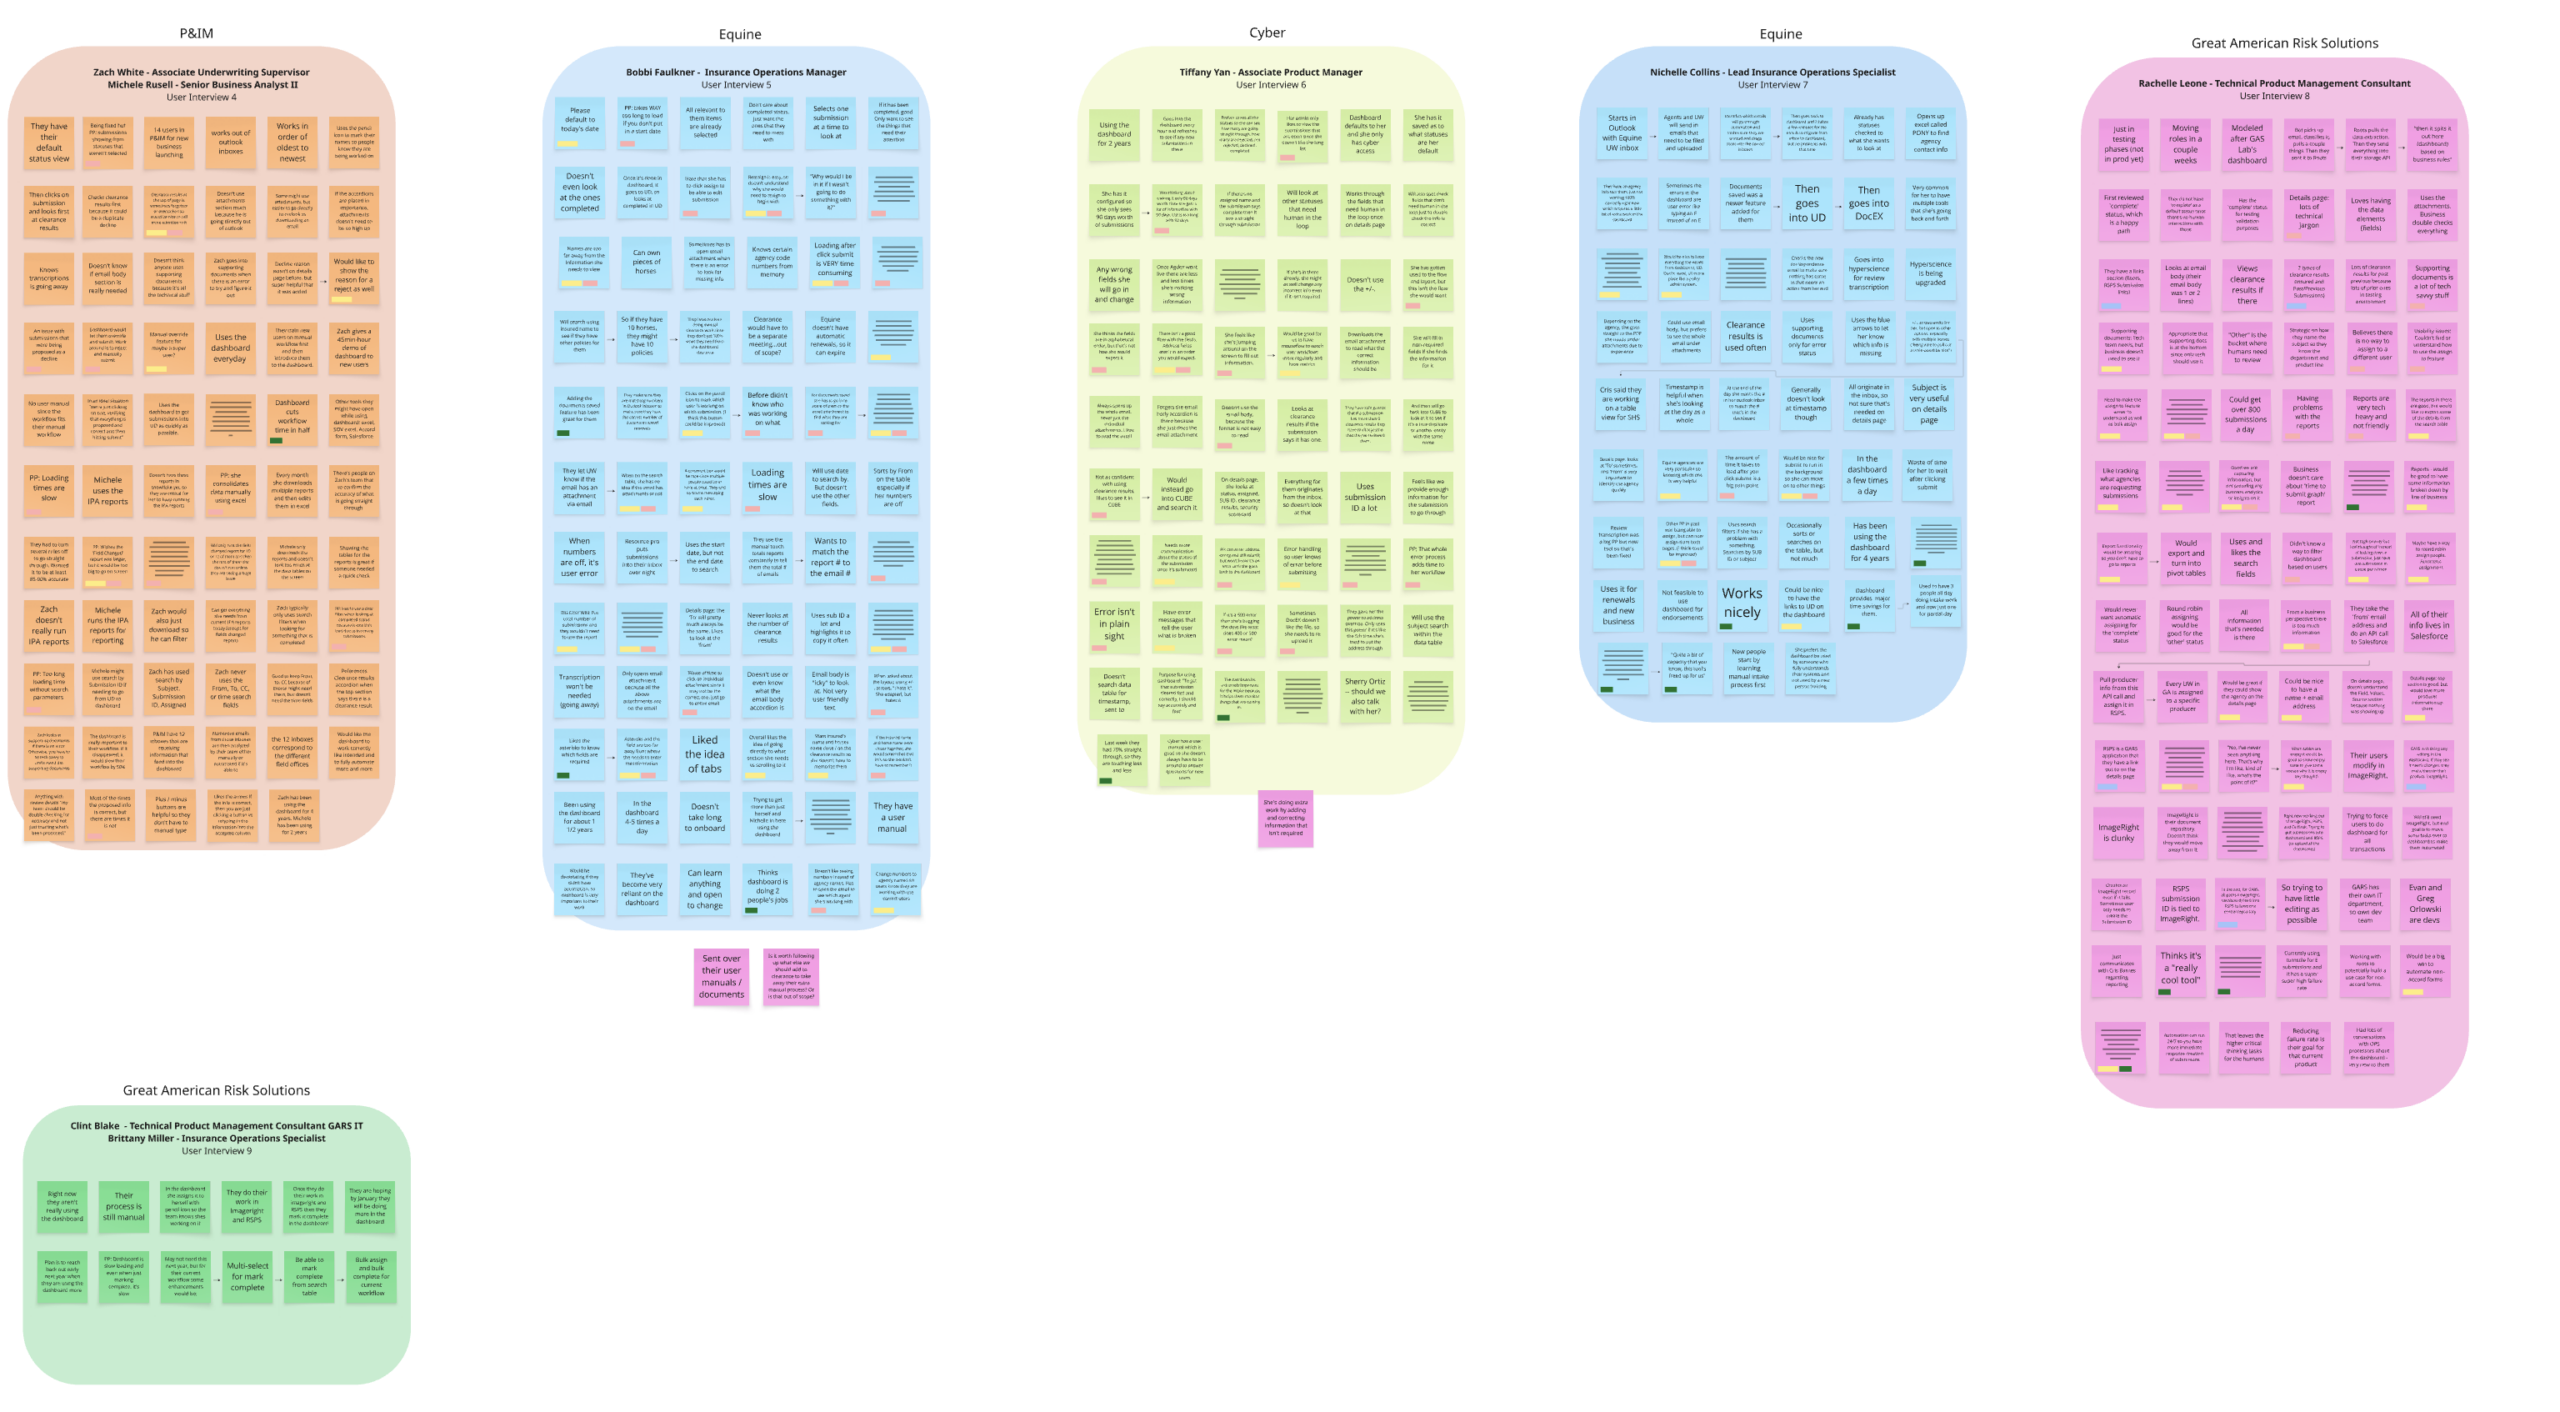
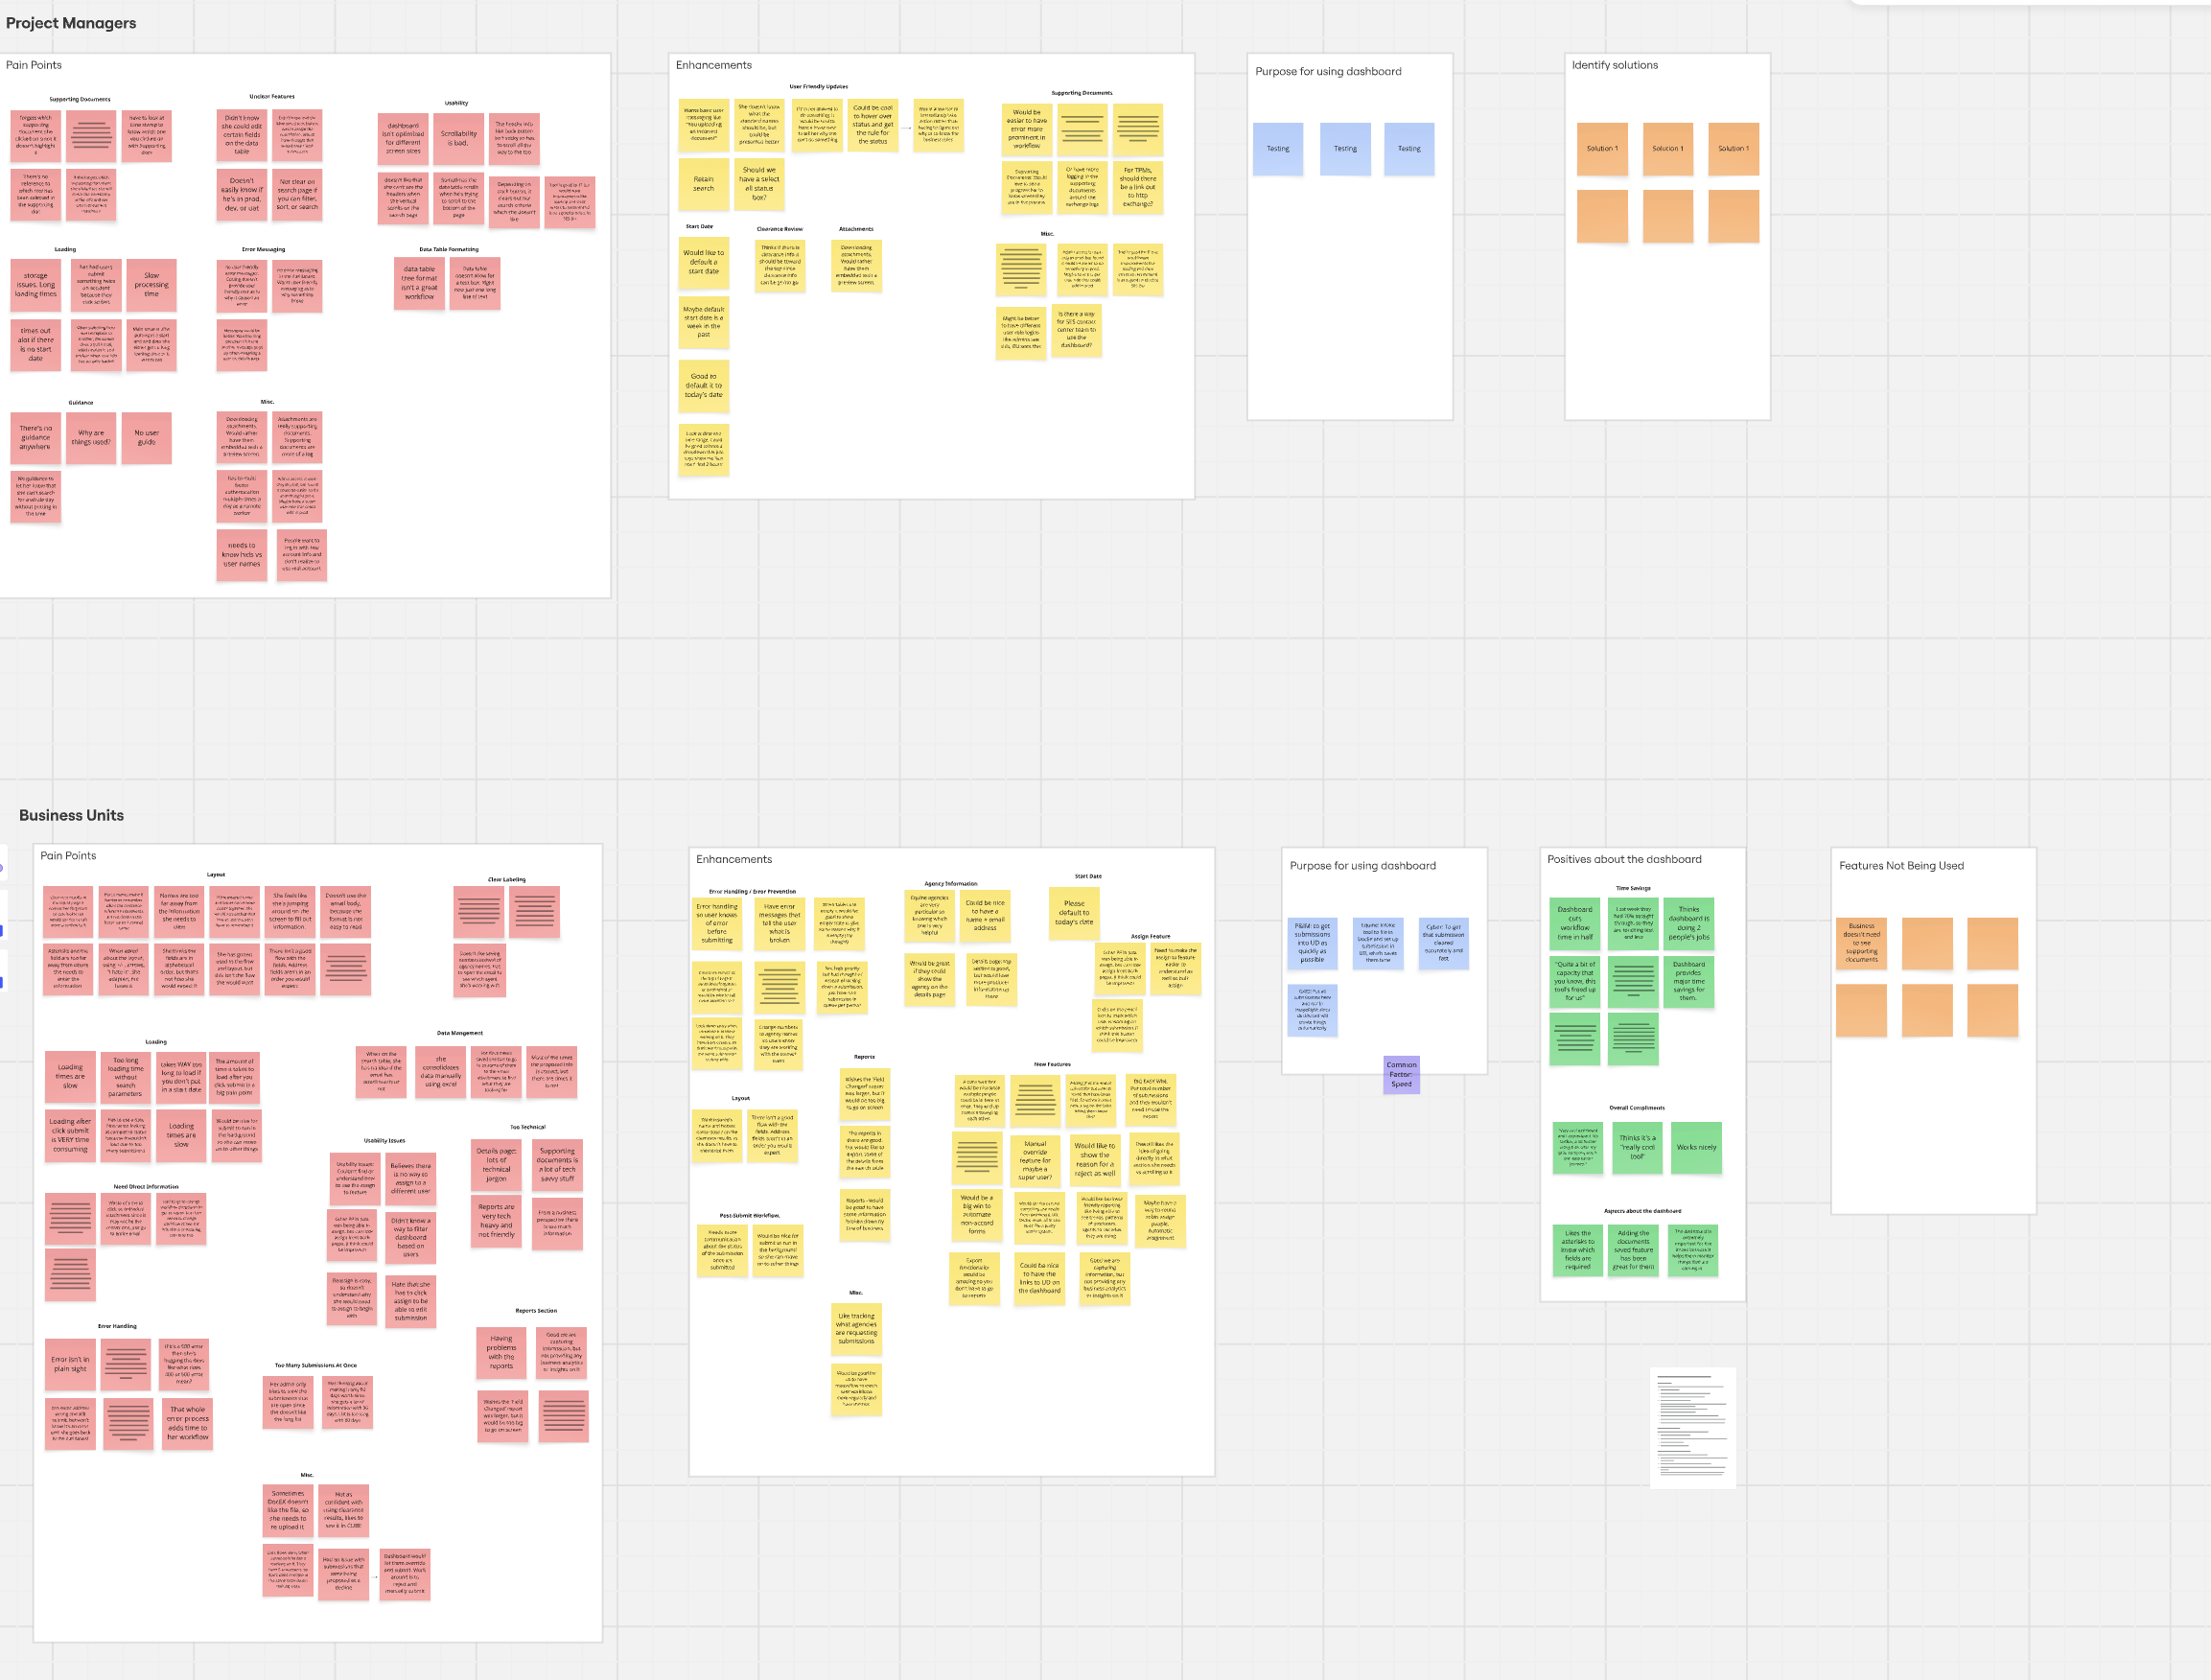
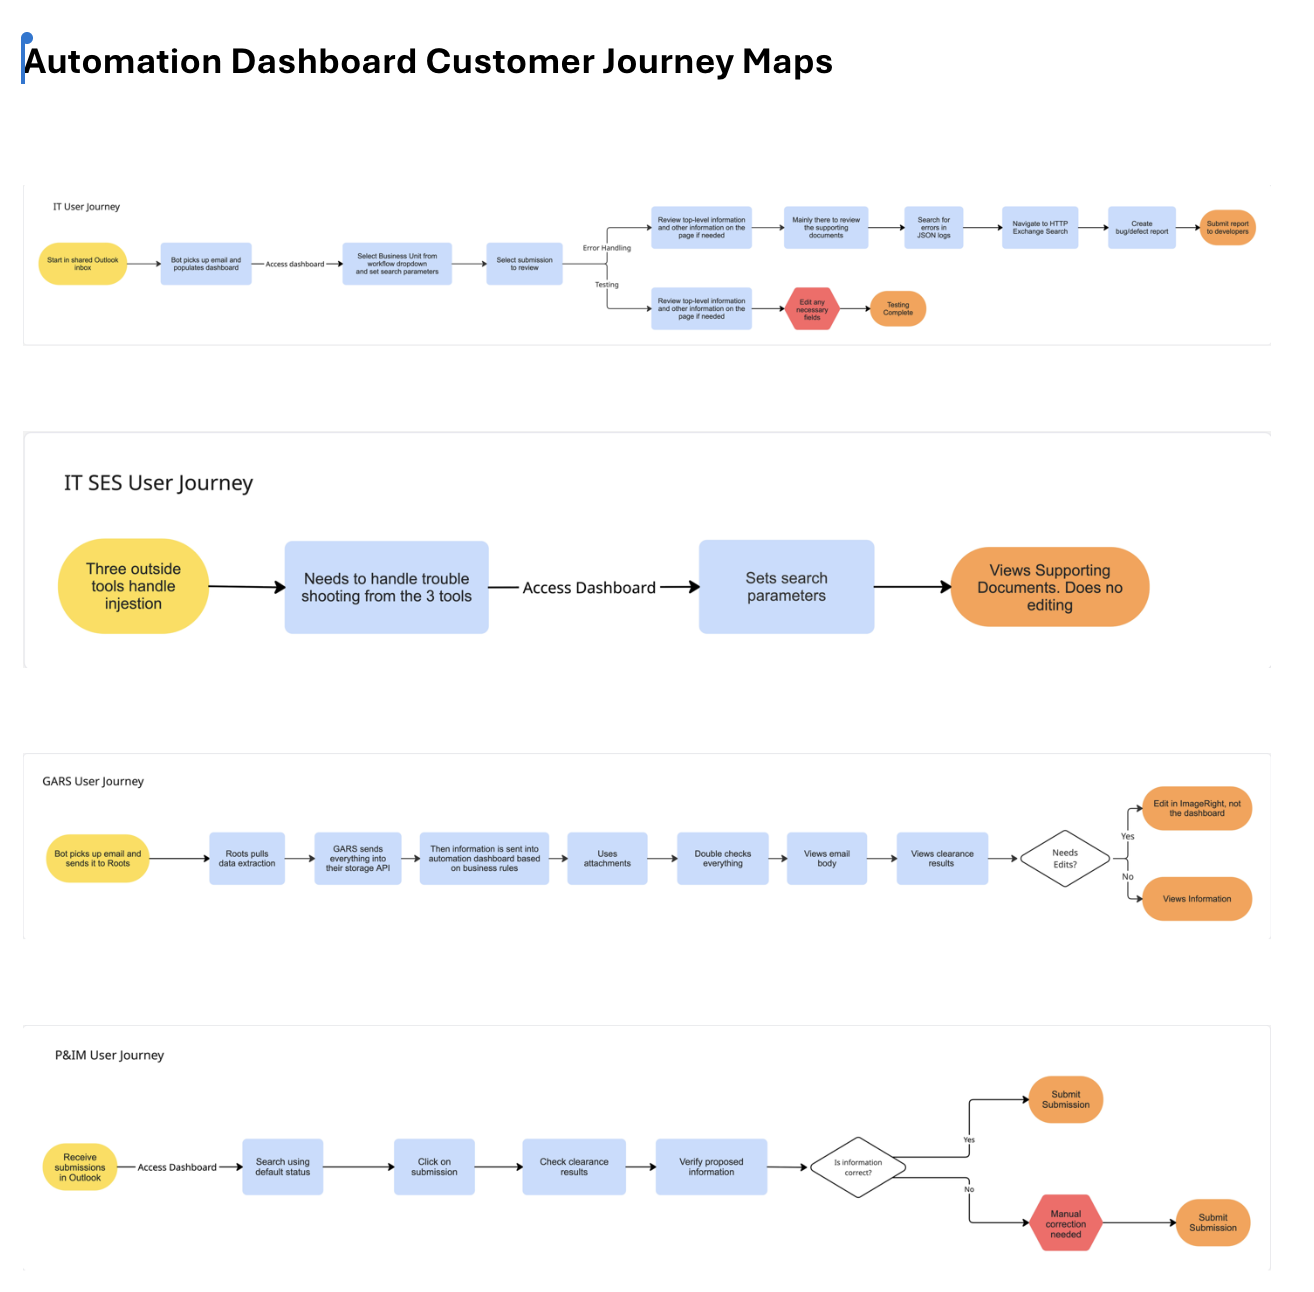
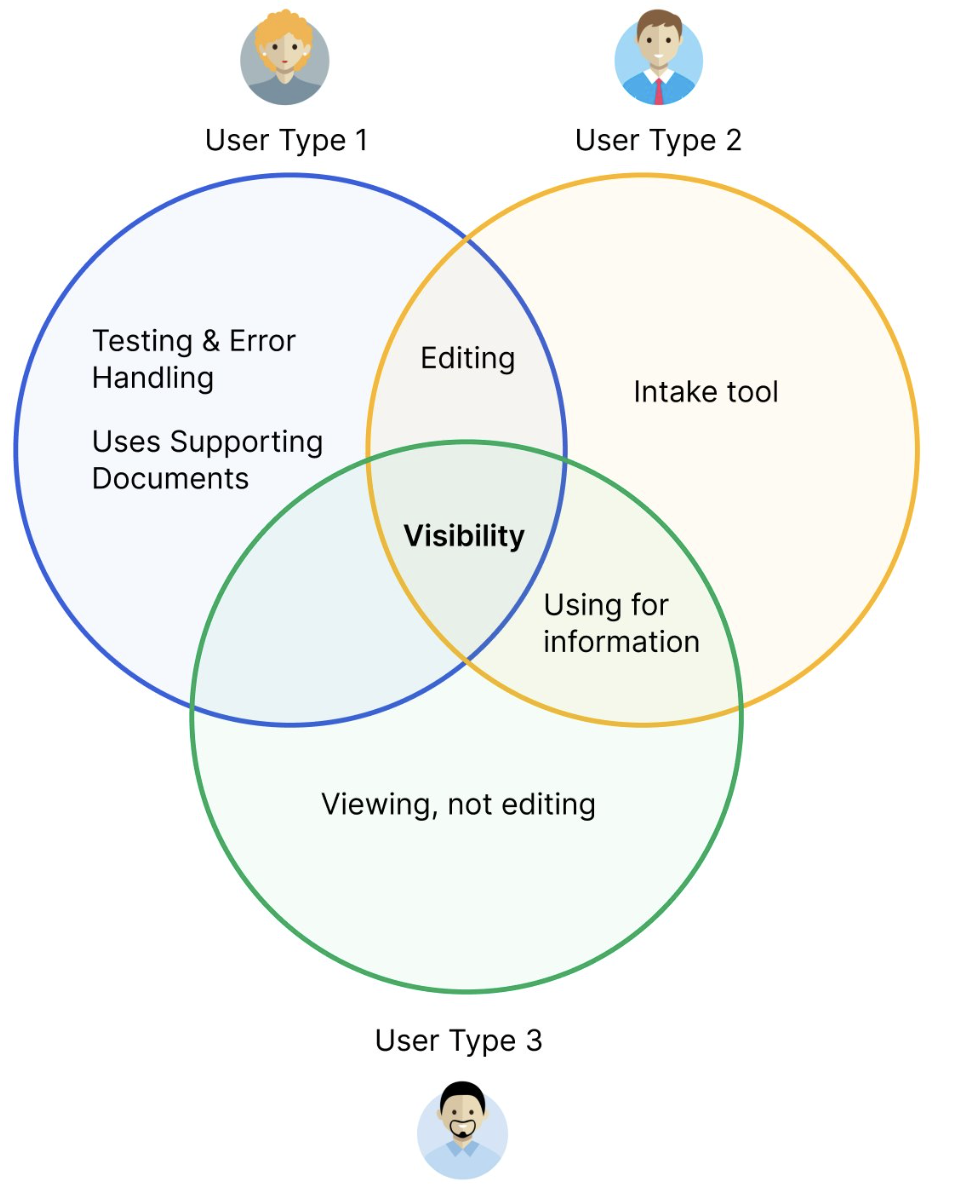
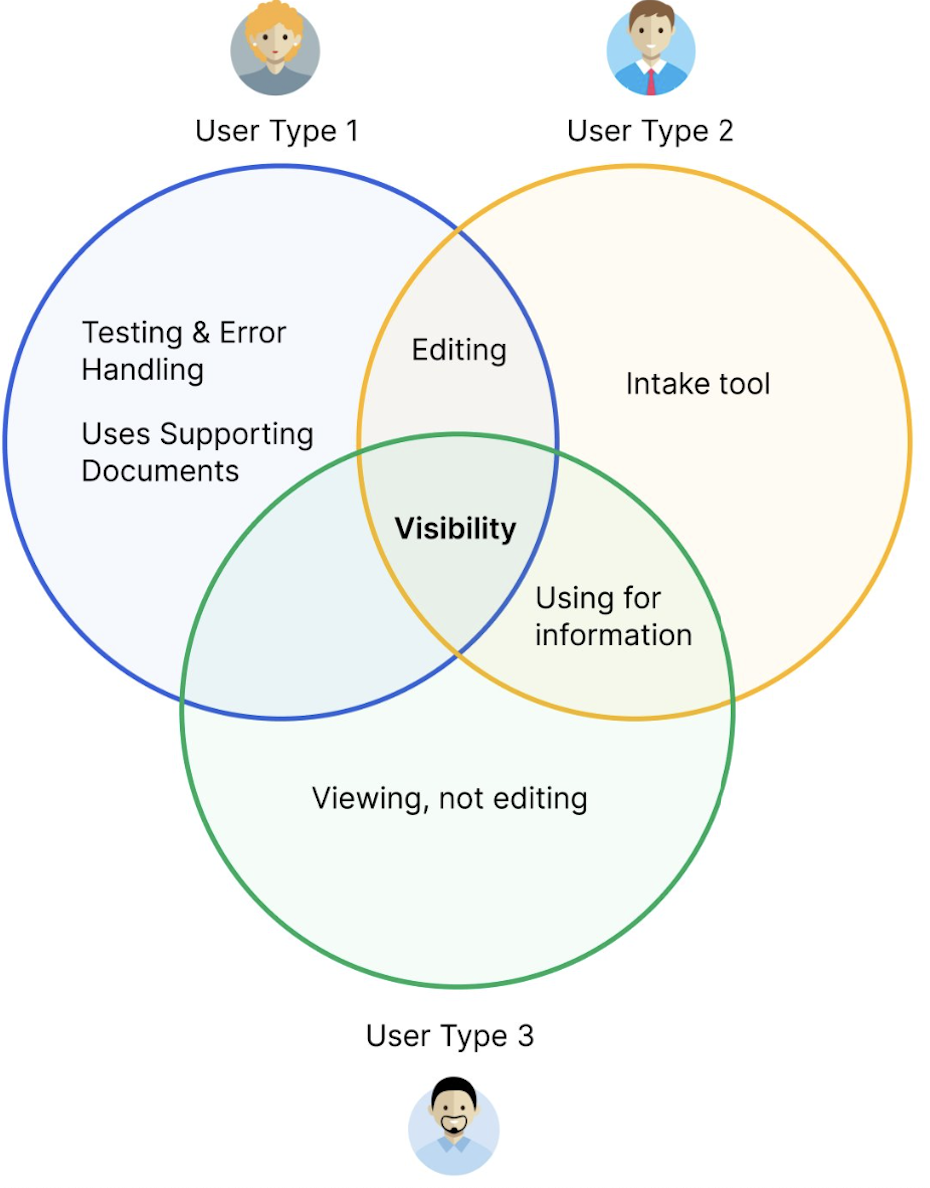
Notes from User Interviews, Categorized Notes, High-level User Journey Maps, & User Type Venn Diagram
Key Learnings
One of the most important takeaways was that the team’s work has been highly valued by users. Feedback included statements such as the automation process “does the work of two people” and is “faster than any human could achieve.” It was important to highlight these successes to reinforce the impact of the team’s efforts.
At the same time, pain points and opportunities for improvement emerged.
Key Findings:
- IT and business units use the dashboard in different ways:
- IT focuses on back-end data accuracy and structure
- Business units prioritize front-end usability and clarity
- IT focuses on back-end data accuracy and structure
- Common issues across all users included:
- Lack of error validation
- Poor readability and user-friendliness of front-end data
- Slow dashboard performance
My conclusion was that the dashboard does not currently align with UX best practices and would benefit from targeted UI enhancements, including adoption of the company’s design system.
Post-Research Impact
After completing the interviews, I synthesized the findings into a comprehensive presentation for the Automation Lab team.
The insights were significant enough to gain visibility at the executive level, including the CIO. Notably, the dashboard has already reduced manual data entry effort by an estimated 2:1 ratio; demonstrating strong ROI despite its usability challenges.
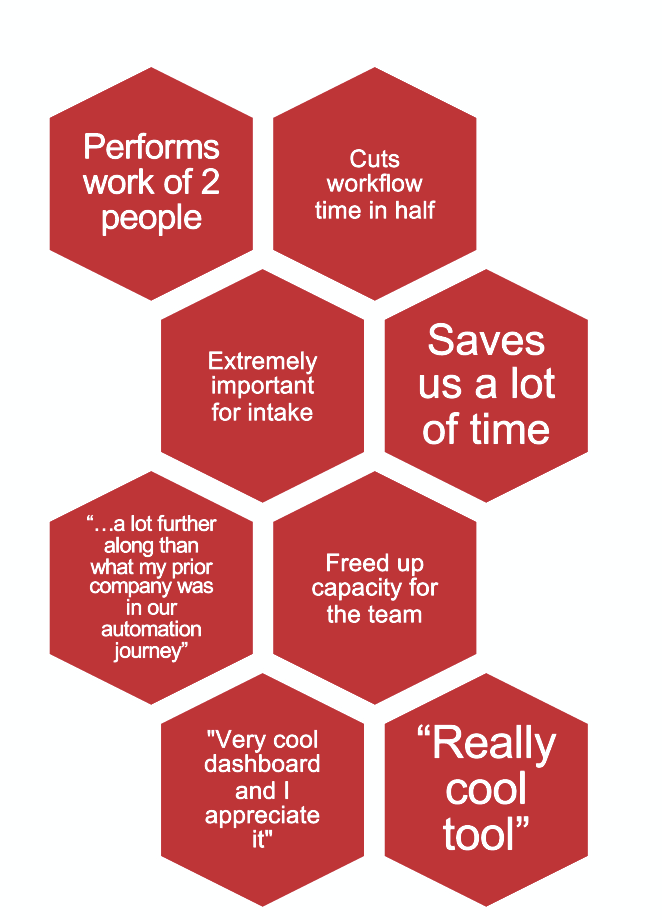
Postive User Feedback
Recommendations
I proposed a two-phase approach:
Phase 1: Incremental Improvement
- Implement high-impact, low-effort UI enhancements
- Align the current dashboard with the company’s design system
- Switch to ROOTS AI to help with dashboard speed
Phase 2: Strategic Redesign
- Reimagine the dashboard UI
- Incorporate continuous user feedback throughout the process
- Introduce dedicated UX support and a full-time product owner
Current State
I currently serve as the sole full-time UX designer within the Automation space. I partnered with project managers to develop 2x2 prioritization matrices for Phase 1 initiatives, which are now actively in development.
Meanwhile, I am collaborating with the product manager and lead developer to define the scope of Phase 2. The addition of a dedicated product owner remains under consideration.
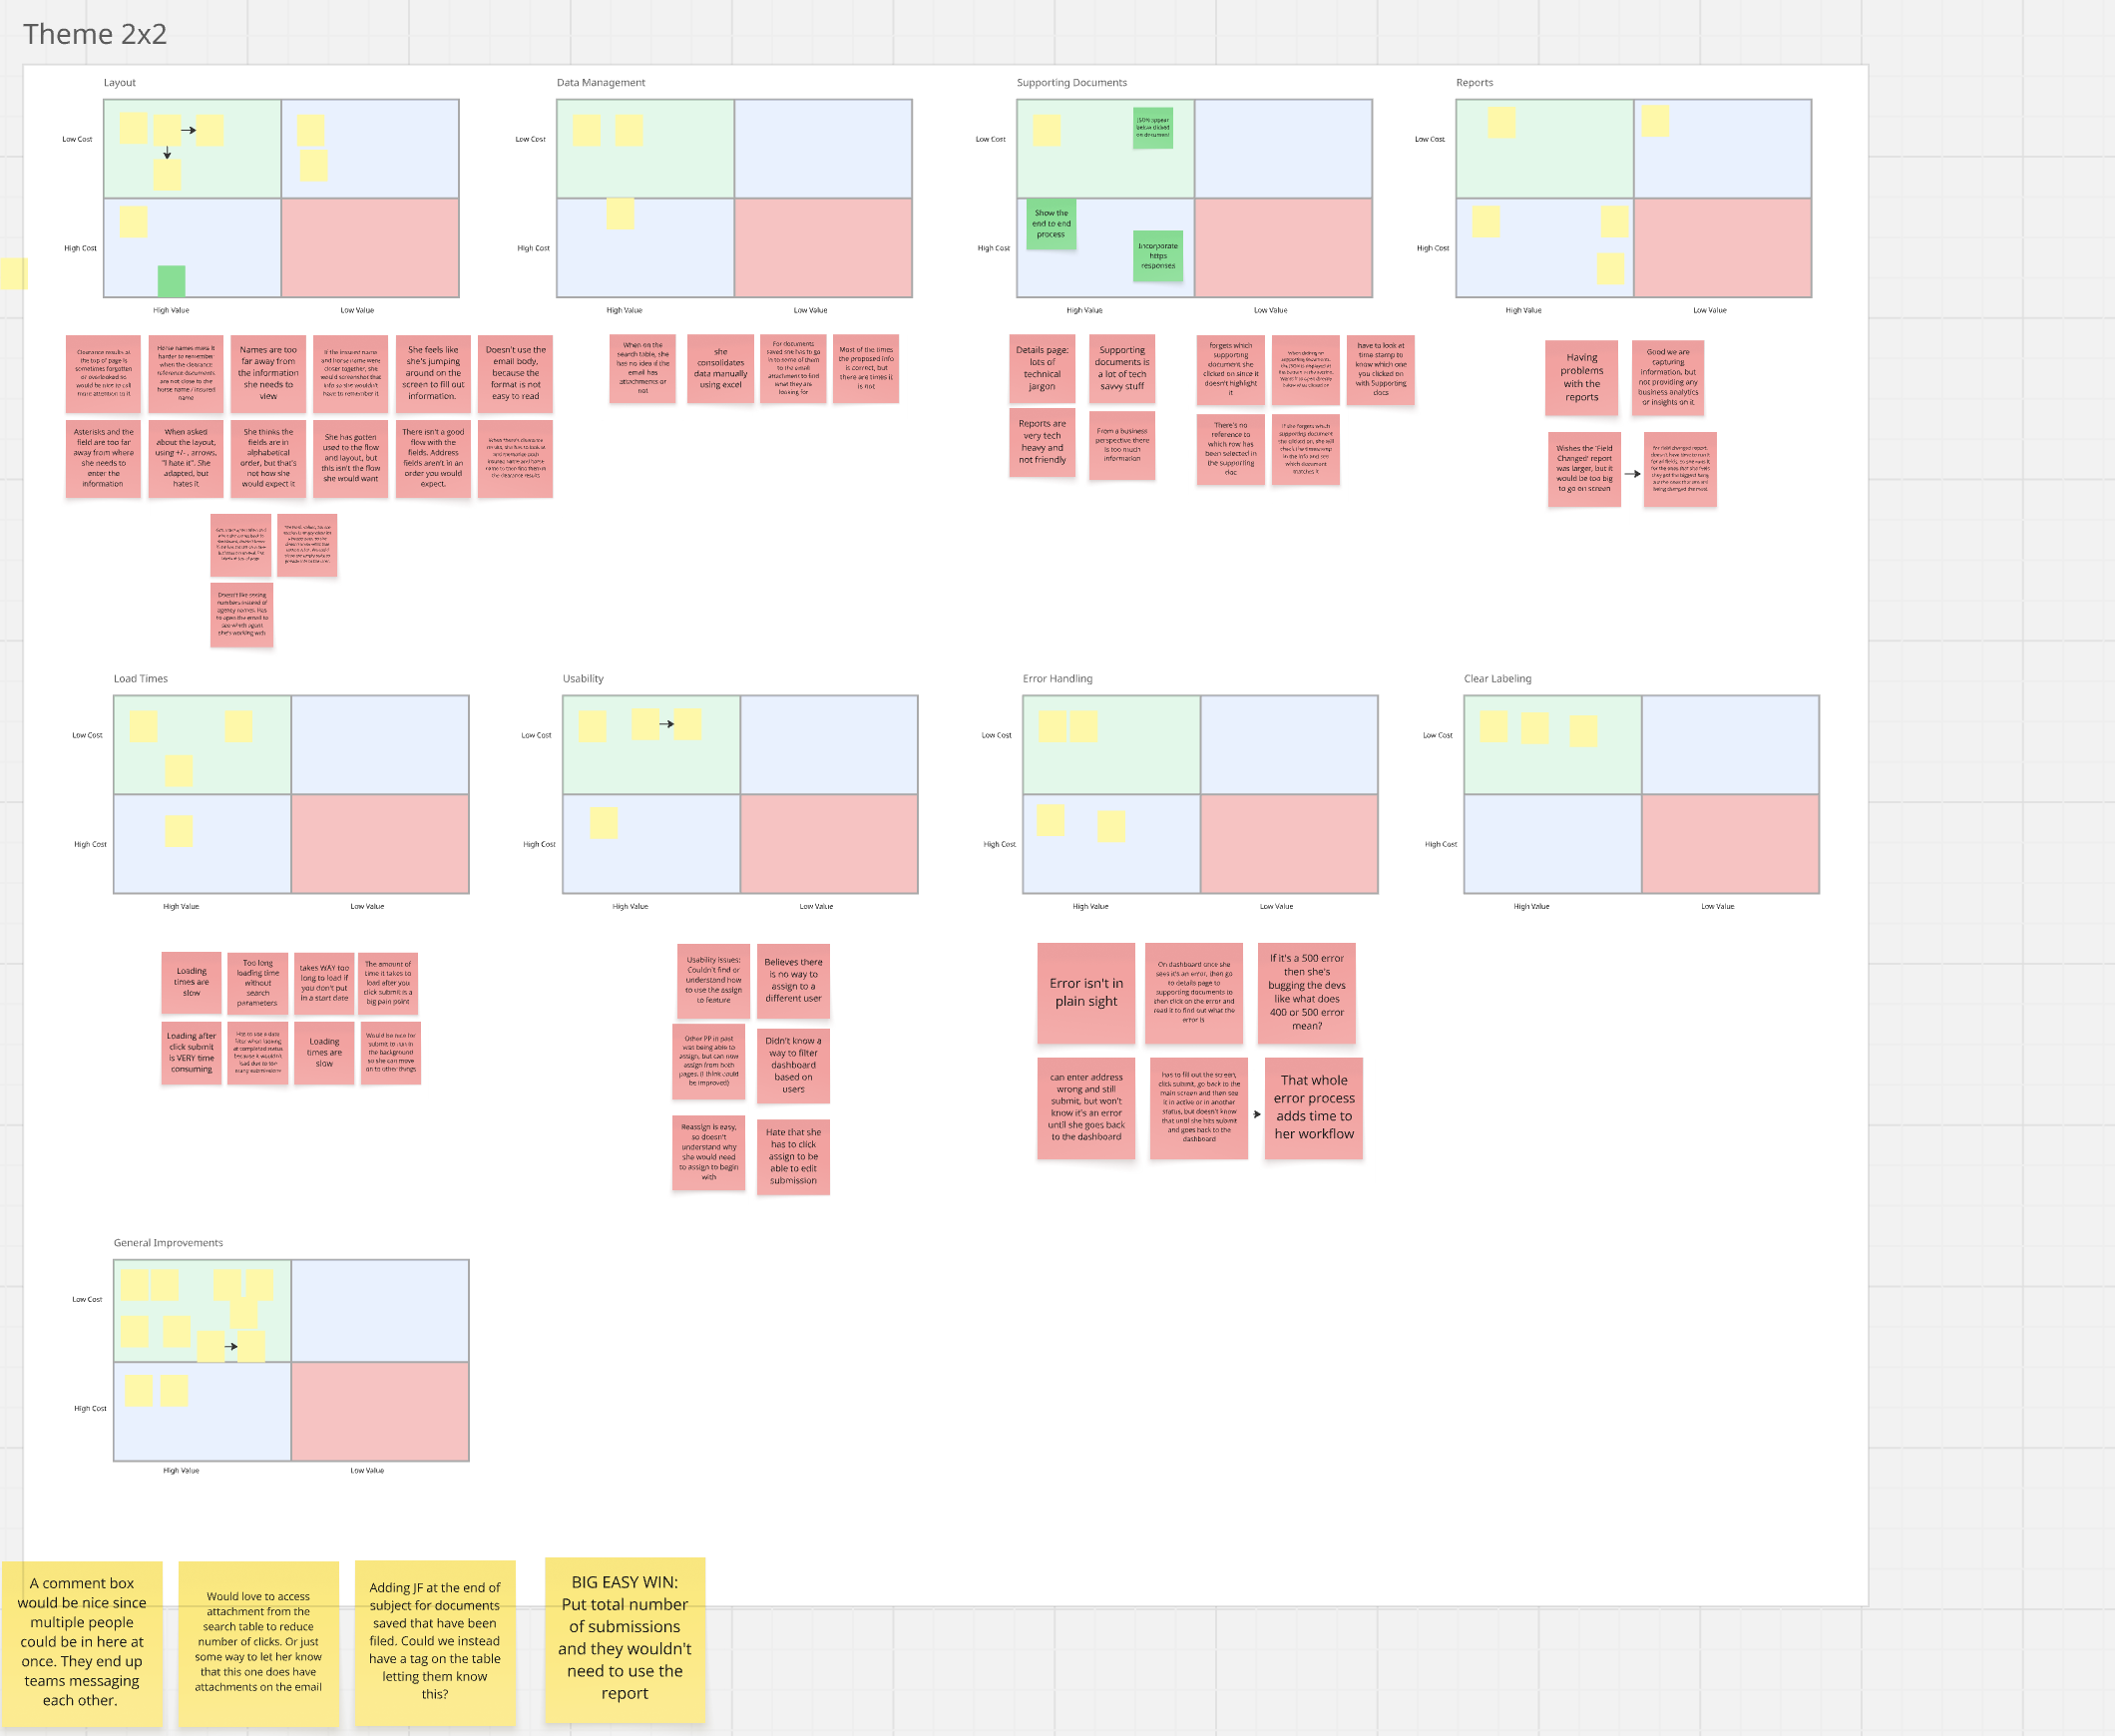
2x2 Prioritization Matrix
What I have learned so far
This experience reinforced that UX adds value at any stage of a product’s lifecycle. Talking directly with users is one of the most effective ways to understand what’s working, what isn’t, and where improvements can make the biggest impact.
I also learned that introducing UX into an established team takes empathy, trust, and collaboration. Taking the time to understand existing workflows and perspectives made it much easier to build alignment and get buy-in on research findings.
Looking ahead, I’m excited to see how the Automation space continues to evolve and how UX can further contribute to its growth.